
Free Bottleneck Calculator – Check CPU & GPU Performance
How to Use This Calculator (Step by Step)
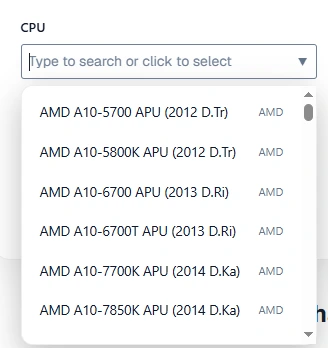
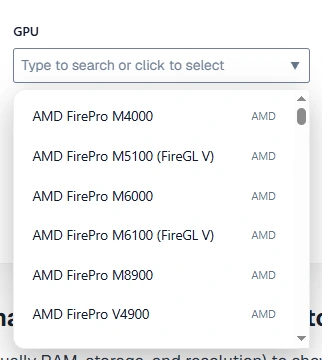
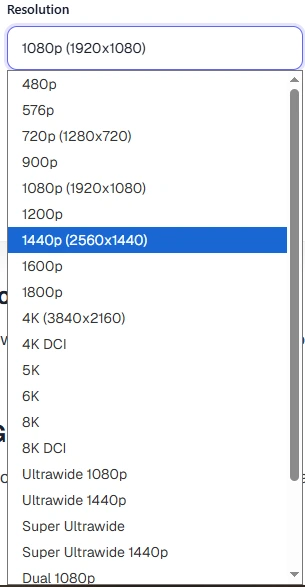
A result under 10% means you’re set. A result over 20% points to a specific upgrade worth planning for, covered next.
What is a Bottleneck Calculator?
A free online tool that compares your CPU and GPU (and usually RAM, storage, and resolution) to show which part is limiting your system’s performance, expressed as a percentage.
What Percentage is Considered Good?
Under 10% is well-balanced. 10–20% is a minor, mostly unnoticeable gap. Above 20% usually means one component is visibly holding you back.
Is a 10% Bottleneck Bad?
No. Some imbalance shows up in almost every build, since CPUs and GPUs are never released on perfectly matched schedules. You won’t feel a 10% gap during actual gameplay.
How Accurate is this Calculator?
It’s built to guide upgrade decisions, not predict exact FPS. Expect the estimate to land within roughly 5–10% of what you’d see in-game; actual results still depend on drivers, game optimization, background load, and cooling. For a deeper look at where these estimates hold up and where they don’t, see are bottleneck calculators actually accurate, plus the Calculator Limitations section below.
Your CPU and GPU work as a two-step pipeline. The CPU works out what needs to happen next, physics, AI behavior, draw calls, then hands that off to the GPU, which turns it into a rendered frame. If your GPU is capable of 200 frames per second but your CPU can only prepare 90 sets of instructions per second, you’re capped at 90 FPS. The GPU spends the rest of its time idle, no matter how powerful it is on paper.
Flip the pairing and the opposite happens: a fast CPU paired with a weak GPU finishes its calculations early and waits while the graphics card struggles to catch up.
A bottleneck calculator puts a number on that gap. Instead of guessing whether your build is “good enough,” you get a percentage, a plain answer for which component is limiting you, and roughly by how much.
Most calculators worth using, including this one, go beyond CPU and GPU. Adding RAM, storage type, and target resolution sharpens the estimate, because a bottleneck at 1080p can look completely different at 4K.
Pro tip: Run the calculator twice, once at your current resolution and once at a resolution you’re considering moving to (say, 1080p to 1440p). Buying a monitor upgrade shifts your bottleneck just as much as buying new hardware does.
The calculator doesn’t run your actual games. It pulls benchmark data for your exact components and estimates how they’ll behave together, adjusted for your resolution and use case.
Hardware Analysis
Each CPU and GPU you select gets a performance score pulled from aggregated benchmark data, similar in spirit to how PassMark or 3DMark rank hardware. The tool compares your CPU’s score against your GPU’s score, adjusted for workload (gaming, rendering, or general use). A large gap signals a likely bottleneck; a small one signals balance.
CPU Performance
Core count, thread count, clock speed, and cache size all factor into the CPU score, not just raw GHz. Modern games spread physics, AI, and background tasks across multiple cores, so a CPU with fewer cores can bottleneck a strong GPU even with a competitive clock speed on paper.
GPU Performance
GPU scores weigh core count (CUDA cores or stream processors), clock speed, VRAM capacity, and memory bandwidth. A card with plenty of raw rendering power can still choke at higher resolutions if it’s short on VRAM, that’s a separate failure mode from raw rendering power, covered in full under VRAM Bottleneck below, and worth checking against the most GPU-intensive games of 2026 if you’re chasing high settings.
RAM Analysis
RAM rarely causes a bottleneck the dramatic way a CPU/GPU mismatch does. Capacity, speed, and channel configuration all factor into your score here; the mechanics are covered in full in How RAM Affects Bottlenecks.
Resolution Analysis
RAM rarely causes a bottleneck the dramatic way a CPU/GPU mismatch does. Capacity, speed, and channel configuration all factor into your score here; the mechanics are covered in full in How RAM Affects Bottlenecks.
FPS Estimation
Finally, the calculator projects an estimated frame rate range using your component scores and resolution. It’s a benchmark-informed estimate, not a guarantee.
| Bottleneck % | What’s Happening | Action Needed |
| 0–10% | Components are well-matched | None, you’re set |
| 10–20% | Small, mostly invisible gap | Monitor, don’t rush to upgrade |
| 20–30% | Noticeable in demanding games | Plan an upgrade for the weaker part |
| 30%+ | One part is clearly holding you back | Upgrade the limiting component soon |
This number isn’t fixed to your hardware alone; it moves with resolution too. The same pairing can post a very different percentage at 1080p than at 4K, see How Resolution Changes Your Bottleneck for why.
System Efficiency Score
This is different from the bottleneck percentage. It scores how well your whole system, RAM and storage included, works together, out of 100. A 15% bottleneck sitting next to a 90+ efficiency score is a build worth leaving alone. That same 15% bottleneck next to a 60 efficiency score means the CPU/GPU pairing is fine, but something else, usually RAM configuration, is costing you performance the bottleneck percentage alone won’t reveal.
Expected FPS
A projected range for your exact hardware and resolution, based on benchmark averages. Two builds can share an identical bottleneck percentage and still land in very different FPS brackets: a balanced budget build and a balanced high-end build can both show 5% bottleneck, but one will outrun the other by a wide margin.
Gaming Tier
| Tier | What to Expect |
| Budget | Solid 1080p at medium-high settings |
| Mid-Range | Strong 1080p/1440p, playable 4K |
| High-End | Smooth 1440p, strong 4K |
| Extreme | Built for 4K and high-refresh gaming |
These labels line up with the budget tiers referenced later in this guide, so a Mid-Range result here matches the Mid-Range pairing suggestions further down. If your tier doesn’t match what you expected for the money you spent, that’s your cue to check the specific bottleneck breakdown more closely.
Upgrade Suggestions
A useful calculator names a specific next step, not a vague “upgrade your GPU.” If your CPU is the bottleneck, it should suggest a chip that closes the gap without overshooting your GPU’s ceiling, avoiding the common mistake of overspending on a CPU your graphics card can’t take advantage of. Since the motherboard often decides which CPU generation you can even run, it’s worth cross-checking against our current pick of the best gaming motherboards before you buy.
A PC bottleneck happens when one component, usually the CPU or GPU, can’t keep up with the rest of the system, capping overall performance regardless of how strong everything else is. It isn’t a defect. Excellent hardware can still bottleneck another component simply from a tier gap, as explained in the pipeline example above.
Signs you’re dealing with one:
- One component sits near 100% usage while the other stays well below it
- FPS barely improves after upgrading one part
- Stuttering or frame drops during busy, demanding scenes
- Lowering resolution doesn’t meaningfully boost FPS (often a CPU bottleneck)
- Lowering graphics settings does boost FPS significantly (often a GPU bottleneck)
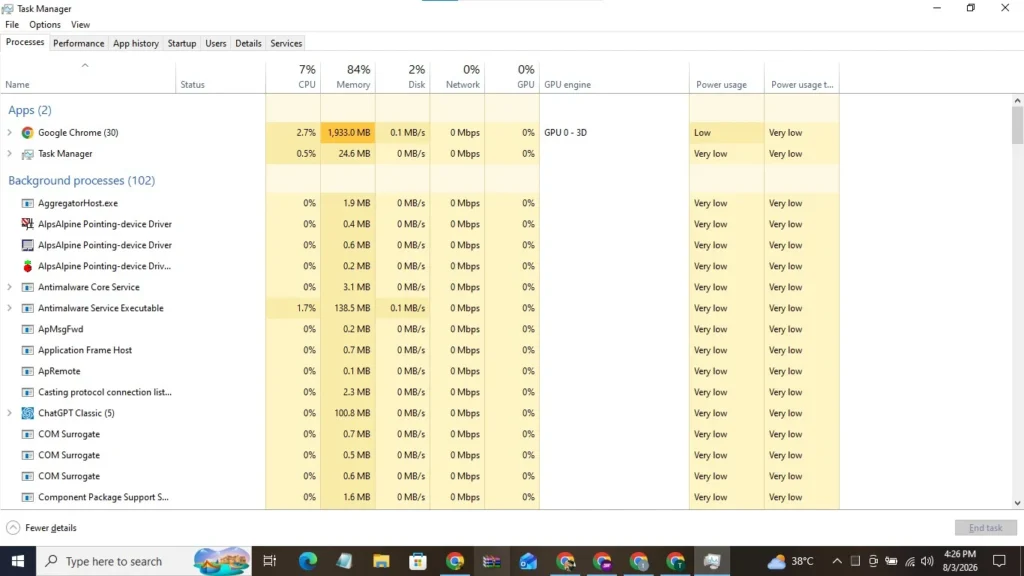
Open Task Manager while gaming. CPU near 100% with GPU usage staying low points to a CPU bottleneck. Reverse the pattern, reverse the conclusion.
Nine distinct types can limit your system, and most bottleneck guides online only really cover the first two.
CPU Bottleneck
The GPU idles while it waits on the CPU to feed it work. Signs: CPU near 100%, GPU noticeably lower; FPS barely changes when you lower resolution. Fix: More cores/threads, close background apps, lower CPU-heavy settings (draw distance, physics).
GPU Bottleneck
The CPU finishes its work and waits on the GPU to render. Signs: GPU near 100%, CPU comfortably lower; lowering resolution or settings noticeably boosts FPS. Fix: Upgrade the GPU, lower resolution/detail, enable DLSS/FSR.
RAM Bottleneck
Not enough memory (or fast enough memory) for the workload, forcing reliance on slower storage. Signs: Stuttering when loading new areas, high memory usage, slow app switching. Fix: 16GB minimum (32GB for heavy multitasking), dual-channel, XMP/EXPO enabled.
Storage Bottleneck
The drive can’t read or write fast enough. This mainly hurts load times, not FPS. Signs: Long load screens, texture pop-in, slow boot. Fix: HDD → SSD or NVMe.
VRAM Bottleneck
The GPU runs out of video memory for your resolution or texture settings. Signs: Texture pop-in, stuttering at high res, sudden frame-time spikes. Fix: Lower texture quality, or upgrade to a GPU with more VRAM (8GB+ for 1440p/4K), especially if you’re running any of today’s most VRAM-hungry titles.
PCIe Bottleneck
The GPU isn’t getting the bandwidth it’s rated for, usually because it’s in a slot wired for fewer lanes, running at an older PCIe generation than it supports, or sharing lanes with an NVMe drive in the wrong M.2 slot. Signs: GPU-Z’s “Bus Interface” reading shows x8 or x4 instead of the card’s rated x16, or an older PCIe generation than the card supports; real-world performance lags behind benchmarks despite normal usage numbers.
Fix: Confirm the card is in the primary x16 slot, check PCIe generation settings in BIOS, and check your motherboard manual for which M.2 slots share lanes with the GPU slot. If you’re shopping for a board that won’t cause this headache in the first place, see our best gaming motherboards guide.
Thermal Bottleneck
CPU or GPU overheats and throttles its own clock speed to cool down. Signs: Performance drops after several minutes; FPS recovers once cooled. Fix: Better airflow, clean dust, reapply thermal paste, upgrade the cooler.
Power Supply Bottleneck
The PSU can’t deliver stable wattage under load. This causes crashes, not slow frame rates. Signs: Random restarts under load, GPU never reaching boost clocks, black screens. Fix: Higher-wattage PSU rated for your combined CPU + GPU draw.
Network Bottleneck
Your connection can’t move data fast or stably enough. This affects online play, not local FPS. Signs: High ping with normal FPS, rubber-banding, packet loss. Fix: Wired Ethernet, close background downloads, pick a closer server.
Common myth: “A bottleneck means one of my parts is broken.” Not true. A bottleneck describes a relationship between two components, not a defect in either one. A perfectly healthy CPU can bottleneck a perfectly healthy GPU simply from the tier gap between them.
Mixing these two up is the most common upgrade mistake people make: you spend money on the wrong part and see almost no improvement.
| CPU Bottleneck | GPU Bottleneck | |
| What’s waiting | GPU waits on CPU | CPU waits on GPU |
| More common at | Lower resolutions (1080p) | Higher resolutions (1440p, 4K) |
| Usage pattern | CPU ~100%, GPU lower | GPU ~100%, CPU lower |
| Resolution fix | Little effect | Lowering resolution helps a lot |
| Settings fix | Lower draw distance, physics, AI | Lower shadows, textures, ray tracing |
| Most affected games | Strategy, simulation, open-world with many NPCs | AAA titles with heavy visual effects |
The fastest way to tell them apart: watch how the number changes as you raise resolution. GPU workload grows fast with pixel count while CPU workload barely moves, so a CPU bottleneck at 1080p often shrinks or disappears at 4K (full explanation in the resolution section below).
If your CPU is the bottleneck, upgrading the GPU won’t fix anything; the new card just waits longer. Upgrade the CPU, close background apps, or lower CPU-dependent settings.
If your GPU is the bottleneck, a CPU upgrade is largely wasted money. Upgrade the GPU, lower resolution/settings, or turn on DLSS/FSR to cut the GPU’s rendering load without new hardware.
Checking usage percentages side by side (Task Manager or MSI Afterburner) is the fastest way to confirm a bottleneck without touching a calculator.
| Pattern | CPU | GPU | What’s Happening |
| CPU Bottleneck | ~100% | ~40% | CPU can’t feed the GPU fast enough |
| GPU Bottleneck | ~40% | ~100% | GPU can’t render fast enough |
| Balanced & Maxed | ~100% | ~100% | Both working hard together, normal for demanding games |
| Underutilized | Low | Low | Task isn’t demanding, no bottleneck present |
A 100/100 reading isn’t a problem, it’s what a well-matched system looks like under a genuinely heavy game. Watch temperatures here, though; sustained full load on both parts puts real thermal stress on your cooling.
A low/low reading just means the game isn’t demanding enough to stress your hardware. If you’re seeing this during a demanding AAA title, check that V-Sync or a frame cap isn’t artificially capping your FPS.
This is the most misunderstood part of bottleneck analysis. People assume their CPU/GPU balance is fixed. It isn’t; it shifts with every resolution jump, because resolution controls how much work lands on the GPU versus the CPU.
1080p
The GPU renders quickly since there are fewer pixels to process, which exposes the CPU as the more likely limiter. High-end GPUs paired with older or budget CPUs often show their worst numbers here. If you play competitive, high-refresh titles at 1080p, your CPU matters more than most people expect.
1440p
For most modern builds, this is where CPU and GPU workloads come closest to balancing out, generally considered the “sweet spot” for mid-range and high-end builds.
4K
The GPU carries the overwhelming majority of the workload, four times the pixel count of 1080p, which shifts the bottleneck decisively toward the graphics card. CPU bottlenecks become far less common here, though not impossible with very weak processors. This is also where VRAM headroom starts to matter most, worth checking against the most demanding GPU games of 2026 before assuming your card is enough.
A CPU showing 25% at 1080p might drop to 8% once you push to 4K, because the GPU absorbs more of the workload as resolution climbs. Check your bottleneck at the resolution you actually play at, not your monitor’s maximum, and not a resolution you’re merely considering. Get this wrong and the calculator points you toward the wrong upgrade entirely, even though the math it ran was correct.
Unlike CPU/GPU imbalance, a RAM bottleneck doesn’t show up as one component maxed out while the other waits. It shows up as stuttering, hitching, and inconsistent frame times, even when CPU and GPU usage both look reasonable.
Capacity: When RAM runs out, Windows starts using your storage drive as overflow memory (paging), which is dramatically slower and causes noticeable stutters.
- 8GB, a common stutter point in 2026’s newer titles, especially with background apps open
- 16GB, the realistic minimum for gaming right now
- 32GB, recommended for heavy multitasking, streaming while gaming, or content creation
Speed: Faster RAM narrows the gap between processor and memory. On AMD Ryzen builds, RAM speed has a measurable impact because the CPU’s internal Infinity Fabric bus scales with memory speed. On Intel, the effect is smaller but still present.
Single vs. Dual Channel
The factor most people overlook: Running two sticks in dual-channel mode roughly doubles memory bandwidth versus one stick of the same total capacity. 16GB in dual-channel will noticeably outperform 16GB in single-channel, especially in CPU-heavy games. If you’re running one stick, adding a matching second one is one of the cheapest upgrades available, often free performance you’re currently leaving on the table.
Common Mistake: Buying more RAM capacity to fix a bottleneck when the real issue is single-channel configuration or disabled XMP/EXPO. Check your channel setup before assuming you need more sticks.
Storage speed doesn’t cause CPU or GPU bottlenecks and won’t change your FPS ceiling, but a slow drive limits load times, asset streaming, and how responsive your system feels overall.
| Storage Type | Relative Speed | Best For |
| HDD | Slowest | Bulk storage only, not OS/games |
| SATA SSD | ~5–6x faster than HDD | General use, most gaming |
| NVMe SSD | ~5–10x faster than SATA SSD | Large open-world games, fast streaming |
If you’re still running your OS or games off an HDD, this is the single easiest upgrade available, full stop.
DirectStorage lets supported games read data directly from an NVMe drive to the GPU, cutting CPU overhead in the loading pipeline. It only helps if the specific game you’re playing has implemented it; owning a fast NVMe drive alone doesn’t activate the feature automatically. Check a game’s system requirements or patch notes before expecting a difference.
Rule of thumb for diagnosing: low FPS points to CPU or GPU; long load screens and a sluggish system point to storage. A faster drive won’t touch your frame rate ceiling, and a faster GPU won’t shorten your load times.
| Use Case | What Matters More | Why |
| Competitive/esports gaming | Clock speed | Lightly threaded games; single-core speed drives FPS |
| Modern AAA/open-world gaming | Core count | Workload spreads across many cores |
| Streaming while gaming | Core count | Encoding needs dedicated cores separate from the game |
| Video editing/rendering | Core count | Render tasks scale directly with available cores |
| General everyday use | Either (6+ cores is plenty) | Rarely CPU-limited at all |
A CPU with 6 fast cores at 5.0GHz will often beat a CPU with 12 slower cores at 3.5GHz in a pure competitive shooter, because that game barely touches more than a handful of cores. Flip to an open-world game with 100+ NPCs on screen, and the 12-core chip pulls ahead; the extra cores handle background calculations the 6-core chip has to queue up.
Practical rule: For gaming builds, look for strong single-core performance plus at least 6 cores/12 threads. That combination covers both competitive titles and modern AAA games. Chasing 16+ cores mainly benefits rendering, streaming, and productivity, not gaming FPS.
Average FPS hides a lot. Two systems can both average 90 FPS, and one feels smooth while the other feels stuttery, the difference is frame time consistency, not the average number.
| Metric | What It Shows | Best For Diagnosing |
|---|---|---|
| Average FPS | Overall performance level | General comparison between builds |
| 1% Low FPS | Consistency during demanding moments | CPU bottlenecks, RAM stutters |
| 0.1% Low FPS | Worst-case, isolated stutters | Background processes, throttling, driver issues |
A big gap between average FPS and 1% low FPS is a strong bottleneck signal, often a CPU struggling in busy scenes or a RAM bottleneck causing brief stutters.
Frame pacing is separate: uneven spacing between frames feels like stutter even when the FPS counter looks fine. Shader compilation stutter is another common cause, short hitches early in a session as the GPU compiles shaders for the first time, fixed by enabling “shader pre-caching” if the game offers it.
When comparing upgrades, weigh 1% lows as heavily as the average, a lower average with tighter 1% lows usually feels smoother than a flashier number with inconsistent delivery.
| Technology | Effect | Best For |
|---|---|---|
| DLSS | Reduces GPU workload | GPU bottleneck (RTX cards only) |
| FSR | Reduces GPU workload | GPU bottleneck (any GPU brand) |
| XeSS | Reduces GPU workload | GPU bottleneck (best on Intel Arc) |
| Ray Tracing | Adds GPU workload | Visual quality, not performance |
| Resizable BAR / SAM | Reduces CPU-GPU transfer inefficiency | Small, free performance gain |
DLSS/FSR/XeSS render at a lower internal resolution and reconstruct a sharper image, cutting the GPU’s actual rendering workload. If you’re facing a GPU bottleneck at 1440p or 4K, this is one of the most effective free fixes available. It won’t help a CPU bottleneck, since CPU workload stays roughly the same regardless of internal render resolution.
Ray tracing can swing a bottleneck reading toward the GPU significantly, sometimes 20–30 percentage points on the same hardware. That’s why ray tracing and upscaling are usually paired in practice: upscaling offsets the extra load ray tracing adds.
Resizable BAR / Smart Access Memory let your CPU access the GPU’s full VRAM at once instead of the old 256MB-at-a-time limit. Gains vary by game, typically 2–8%. Not a bottleneck fix on the scale of upscaling, but free performance worth enabling in BIOS if your board and GPU both support it.
| Tool | Best For | Key Strength |
| Task Manager | Quick, no-install check | Already built into Windows |
| MSI Afterburner | Real-time in-game overlay | Temperature + usage together |
| HWInfo | Deep diagnostics | Per-core, per-sensor detail |
| FrameView | Frame consistency analysis | 1% and 0.1% low tracking |
| CapFrameX | Frame time capture & review | Post-session analysis and graphs |
| GPU-Z | PCIe/bus diagnostics | Confirms slot generation and lane width |
Task Manager: Press Ctrl+Shift+Esc, click Performance, watch CPU vs. GPU usage while playing. Fast, but it updates slowly and doesn’t break down per-core usage, so it can miss a bottleneck caused by one or two overloaded cores while overall usage looks moderate.
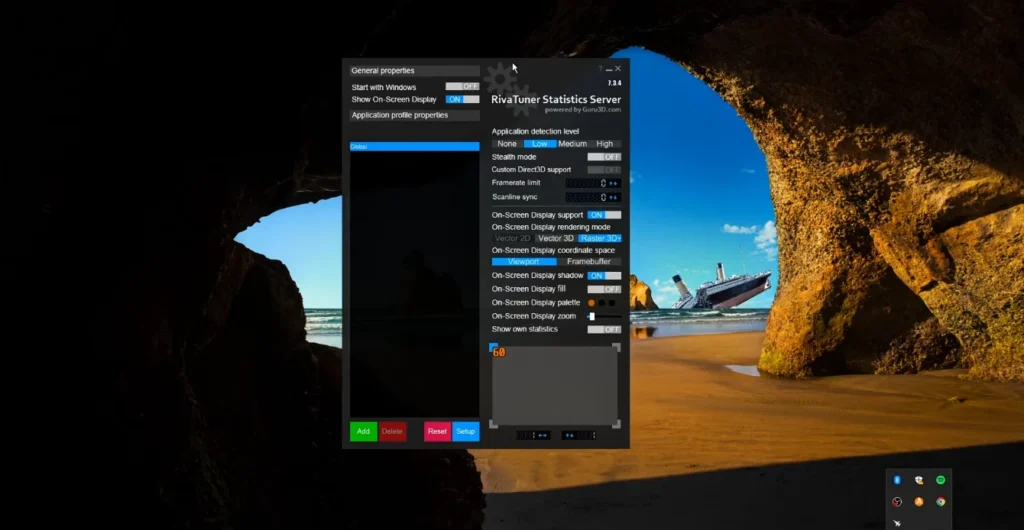
MSI Afterburner (free, works with any GPU brand), paired with RivaTuner Statistics Server, shows real-time CPU, GPU, RAM, temperature, and FPS directly on screen. It’s the most commonly recommended tool because it updates instantly and shows temperature alongside usage, catching thermal throttling at the same time.
HWInfo (HWiNFO64) gives the most detailed sensor data available: per-core usage, individual voltage rails, granular temperatures. Use it when Task Manager or Afterburner show moderate usage but you’re still getting stutters; it can reveal a single core spiking to 100% while the rest sit idle.
FrameView (NVIDIA-made, works with AMD/Intel GPUs too) focuses on frame-time analysis: logging average FPS, 1% lows, and 0.1% lows. Use it when usage percentages alone aren’t giving you a clear answer.
CapFrameX builds on the same frame-time data Afterburner and FrameView capture, but it’s built for reviewing runs after the fact, useful for comparing a “before and after” of a settings change or driver update rather than watching numbers live.
Workflow: Start with Task Manager. Unclear result or suspected throttling → MSI Afterburner. Suspect a single overloaded core or unexplained stutters → HWInfo. Suspect PCIe lane issues → GPU-Z. Want to compare two configurations side by side → log both runs in CapFrameX or FrameView.
Gaming gets most of the attention in bottleneck discussions, but the CPU/GPU relationship looks different once you add a second workload on top.
Streaming (OBS or similar)
Streaming while gaming effectively runs two jobs on your PC at once, the game itself and video encoding for the stream. Software (x264) encoding leans heavily on CPU cores the game isn’t using, which is why streamers benefit disproportionately from higher core counts even if their gaming-only bottleneck looks fine.
Hardware encoding (NVENC on NVIDIA, similar on AMD/Intel) offloads that work to a dedicated block on the GPU instead, freeing CPU cores for the game, the better default for most streamers unless you’re chasing the best possible encode quality at a given bitrate.
Video editing and rendering
Export and render times scale with core count far more directly than gaming FPS does, since rendering is a heavily parallel workload. A CPU that looks “balanced” for gaming can still be the clear bottleneck for a render-heavy workflow, and vice versa, a strong multi-core CPU paired with a modest GPU can render competently even while it’s GPU-bottlenecked in games.
Local AI workloads
Running local machine learning models or AI-assisted creative tools shifts the bottleneck conversation toward VRAM capacity and memory bandwidth more than raw core count or clock speed. A GPU that handles gaming comfortably can still run out of VRAM headroom for larger local models, a different failure mode than a gaming bottleneck, and one this calculator isn’t built to estimate.
VR gaming
VR headsets typically demand a higher, more consistent minimum frame rate than flat-screen gaming to avoid discomfort, which raises the bar for both CPU and GPU at once rather than shifting load toward one or the other the way resolution does on a monitor. Treat VR headroom requirements as a separate, stricter target than the flat-screen resolution guidance elsewhere in this guide.
Bottom line for multi-tasking use cases: a gaming-only bottleneck reading doesn’t tell you much about how your PC handles streaming, editing, or local AI workloads layered on top. Core count and VRAM headroom decide those outcomes far more than they decide gaming FPS.
| Tier | Target Resolution | Typical Bottleneck Risk |
|---|---|---|
| Budget | 1080p | Low, components are naturally matched |
| Mid-Range | 1440p | Low, but RAM config matters more |
| High-End | 1440p/4K | Resolution choice significantly affects balance |
| Extreme | 4K | Shifts toward power/thermal considerations |
Budget
6-core mid-range CPU + entry-to-mid GPU with 8GB VRAM + 16GB dual-channel RAM. Targets smooth 1080p at high-medium settings. At this tier, CPU and GPU are typically evenly matched by design; budget GPUs simply don’t have enough power to expose a CPU bottleneck.
Mid-Range
6–8 core current-gen CPU with strong single-core clocks + mid-tier GPU with 12GB VRAM + 32GB dual-channel RAM with XMP/EXPO enabled. Targets 1440p high settings with headroom for 1080p high-refresh competitive play. RAM speed and channel config start mattering more here.
High-End
High-core-count current-gen CPU + high-end GPU with 16GB VRAM + 32GB high-speed dual-channel RAM. Targets 1440p ultra and playable-to-strong 4K. Resolution choice matters more than ever at this tier; the same components can lean CPU at 1080p and GPU at 4K.
Extreme
Flagship CPU + flagship GPU with 16GB+ VRAM + 32–64GB highest stable rated speed. Targets 4K ultra, high-refresh 1440p, or simultaneous streaming/rendering. At this tier, the conversation often shifts away from CPU/GPU balance entirely and toward PSU capacity and cooling; flagship parts draw serious power and generate real heat under sustained load. A motherboard that can actually deliver stable power to these chips matters here, see our best gaming motherboards picks.
Common Mistake: Overspending on a flagship CPU for a budget-tier GPU build “to future-proof it.” In gaming, the GPU limits your experience long before CPU headroom becomes relevant. That money is better spent on the GPU or saved for the next upgrade cycle.
Exact bottleneck percentages shift constantly with new game patches, driver updates, and benchmark revisions, a specific number printed today can be stale within weeks. Rather than quoting a figure that might already be outdated by the time you read this, here’s how to reason through three common pairings using the principles above. Run your exact combination through the calculator for a live number.
Ryzen 5 5600 + RTX 4060
A solidly matched mid-budget pair. The 5600 is a capable 6-core, 12-thread CPU with strong single-core performance; the RTX 4060 sits at a similar tier, an 8GB mid-range card built for 1080p and light 1440p. At 1080p, expect this pairing to run close to balanced. At 1440p, the GPU’s 8GB VRAM ceiling is more likely to become the limiting factor than the CPU, especially in newer texture-heavy titles. RAM configuration matters more here than the CPU/GPU pairing itself; run dual-channel with XMP enabled, since this budget tier has less headroom to absorb a soft RAM bottleneck.
Ryzen 7 7800X3D + RTX 5080
A deliberately CPU-forward combination. The 7800X3D’s large 3D V-Cache is known for strong gaming performance, particularly at lower resolutions. At 1080p, this CPU has more than enough headroom to fully feed the 5080, so any bottleneck reading will more likely lean GPU-side simply because the card is working near its limit even at lower resolutions. At 4K, the balance shifts further toward the GPU. This is a build where enabling DLSS at 4K makes a real difference; it reduces GPU load without touching the CPU side, which is already comfortably ahead.
Core Ultra + RTX 5070
Intel’s Core Ultra uses a Performance/Efficiency core architecture; paired with the RTX 5070’s 12GB VRAM and mid-high tier, this generally produces a well-balanced result across 1080p and 1440p, less likely to show a dramatic imbalance than mismatched budget/flagship combos. Confirm your motherboard BIOS and chipset drivers are current; newer CPU architectures sometimes see early performance gains from platform-level updates that older benchmark data won’t reflect.
A calculator tells you where you stand today. Planning your next upgrade means thinking about where you’ll stand in 18–24 months, a different question entirely.
GPUs age Faster than CPUs, in Practical Terms
New rendering techniques, VRAM requirements, and game engine demands tend to push GPUs toward obsolescence before a comparable-tier CPU becomes the limiting factor. A reasonable default: budget for a GPU upgrade roughly every other generation, and expect a well-chosen CPU to comfortably outlast two GPU upgrade cycles.
Buy the CPU for Today’s Games, not Tomorrow’s Rumors
Overbuying core count now “just in case” future games need it rarely pays off; game engines evolve, and by the time a game meaningfully uses 16 cores for gameplay logic, the CPU landscape has moved on anyway. Match your CPU tier to your GPU tier for the resolution you play at now.
VRAM is the Exception to “Buy for Today.”
Unlike core count, VRAM requirements have climbed steadily across recent years, and a GPU that’s short on VRAM ages out of usefulness faster than one that’s merely a tier behind on raw compute. If you’re choosing between two GPUs at a similar price with different VRAM capacities, the extra VRAM is usually the safer long-term bet, particularly at 1440p and above.
A Practical Upgrade Sequence for most Builders
Diagnose first (calculator + Task Manager), fix free issues (XMP/EXPO, drivers, background apps), then address the single largest bottleneck, not both components at once, unless your current bottleneck genuinely exceeds 30% on both. Spreading a limited budget across two half-upgrades usually delivers less than fully addressing one.
Being upfront about this makes the number you get more useful, not less.
- It doesn’t know your specific game: Engine optimization varies enormously; a CPU-heavy strategy title and a GPU-heavy shooter will behave differently on identical hardware, and a general-purpose calculator can’t model every engine individually.
- It can’t see your cooling or case airflow: Two identical builds can perform differently if one is thermal-throttling and the other isn’t; the calculator assumes hardware running at its rated specification.
- It doesn’t account for background software: Overlays, RGB control software, antivirus scans, and browser tabs all compete for CPU and RAM in ways a spec-based estimate can’t predict.
- Driver version and game patches shift real results: After the estimate is generated; benchmark databases update periodically, not in real time with every driver release.
- It won’t catch a misconfigured system: Disabled XMP, single-channel RAM, or a PCIe slot running below its rated generation won’t show up in a spec-based comparison, only in real-world testing on your actual machine.
Use the calculator to narrow down which component is the likely limiter and roughly by how much, then confirm with Task Manager, Afterburner, or GPU-Z on your actual system before spending money.
| Mistake | Why It Costs You | The Fix |
| Upgrading without diagnosing | Spends money on the wrong part | Run a bottleneck check first |
| Flagship GPU + budget CPU | GPU sits underused | Match CPU tier to GPU tier |
| Flagship CPU + budget GPU | CPU sits underused | Match GPU tier to CPU tier |
| Chasing core count for gaming | Pays for cores gaming won’t use | Prioritize single-core speed + 6–8 cores |
| Ignoring resolution | Buys the wrong-sized upgrade | Confirm target resolution first |
| More RAM instead of dual-channel/XMP | Misses a free fix | Check channel config and BIOS settings first |
| Skipping the PSU check | Causes instability, not smooth gains | Verify PSU wattage before a GPU upgrade |
| Testing at the wrong resolution | Leads to an unnecessary upgrade | Test at your actual playing resolution |
| Ignoring VRAM for the resolution you play | GPU ages out early despite good compute | Prioritize VRAM headroom at 1440p/4K |
The most expensive mistake on this list, by a wide margin, is the first one: buying a new GPU because “the PC feels slow” without checking whether CPU, GPU, RAM, or storage is actually the culprit. That’s hundreds of dollars spent chasing a guess.
Is a 20% Bottleneck Bad?
It’s noticeable. At 20%+, one component is visibly limiting your performance in demanding games, and it’s worth planning an upgrade for the weaker part, though it’s rarely urgent unless you’re also seeing stuttering or frame drops.
Does RAM Cause a Bottleneck?
Rarely in the dramatic way CPU or GPU mismatches do. Insufficient capacity, slow speed, or single-channel configuration can quietly limit performance through stuttering and inconsistent frame times, even when CPU/GPU usage looks fine.
What’s a Good Bottleneck Percentage for Gaming?
The 10/20/30% bands above hold for most builders, but your tolerance should shift with what you’re playing. Competitive shooters where 1% lows matter more than average FPS deserve a stricter target, closer to 10%, while a single-player, story-driven game at 20% will rarely be something you consciously notice.
Can a Bottleneck Damage my PC?
No. A bottleneck limits performance, not hardware longevity. The exception is a thermal bottleneck caused by inadequate cooling; sustained overheating can shorten component lifespan, a separate and more serious issue worth addressing directly.
Does Upgrading RAM fix a CPU Bottleneck?
No. RAM and CPU bottlenecks are different problems with different symptoms. If your CPU is the limiting factor, more RAM won’t close that gap; you need a CPU with more cores/threads or stronger single-core performance.
Is Bottlenecking Normal?
Yes. Some degree of bottleneck exists in nearly every PC build, since CPU and GPU releases never land on the exact same upgrade cycle. A small bottleneck under 10% is expected and not something to chase into zero.
Does Resolution Affect my Bottleneck?
Significantly. Lower resolutions shift the load toward your CPU; higher resolutions shift it toward your GPU. The same hardware pairing can show a very different bottleneck percentage at 1080p versus 4K, always check at the resolution you actually play at.
Does a Bottleneck Affect Streaming or Video Editing the same way it Affects Gaming?
Not exactly. Streaming and rendering lean much more heavily on CPU core count than gaming FPS typically does, so a system that’s well-balanced for gaming can still be CPU-limited for encoding or export tasks, and vice versa.
Will a Bottleneck Calculator tell me my Exact FPS in a Specific Game?
No. It gives a benchmark-informed range based on your components and resolution, not a per-game guarantee. Engine optimization, patches, and settings all shift real FPS beyond what a spec comparison can capture.
Should I Worry about a Bottleneck on a Brand-New, Top-Tier Build?
Generally no. A small bottleneck is expected even in flagship-tier pairings, since CPUs and GPUs rarely launch on perfectly matched cycles. Focus on whether the number is under roughly 20%, not whether it’s exactly 0%.
Most bottleneck tools stop at CPU and GPU. This one factors in RAM channel/capacity and storage type too, because a build can look perfectly balanced on CPU vs. GPU alone and still stutter from a single-channel RAM kit or an undersized drive. The upgrade suggestion it gives names an actual component tier rather than a generic “upgrade your GPU,” and the FPS estimate is shown as a range rather than a falsely precise single number, a more honest reflection of what benchmark-based prediction can actually promise.
Run your specs above, then use the sections on this page, CPU vs. GPU diagnosis, resolution effects, streaming and content-creation workloads, or the fix checklist, to figure out exactly what your result means for your next upgrade.