Are Bottleneck Calculators Accurate? The Truth Behind CPU & GPU Bottleneck Results (2026)
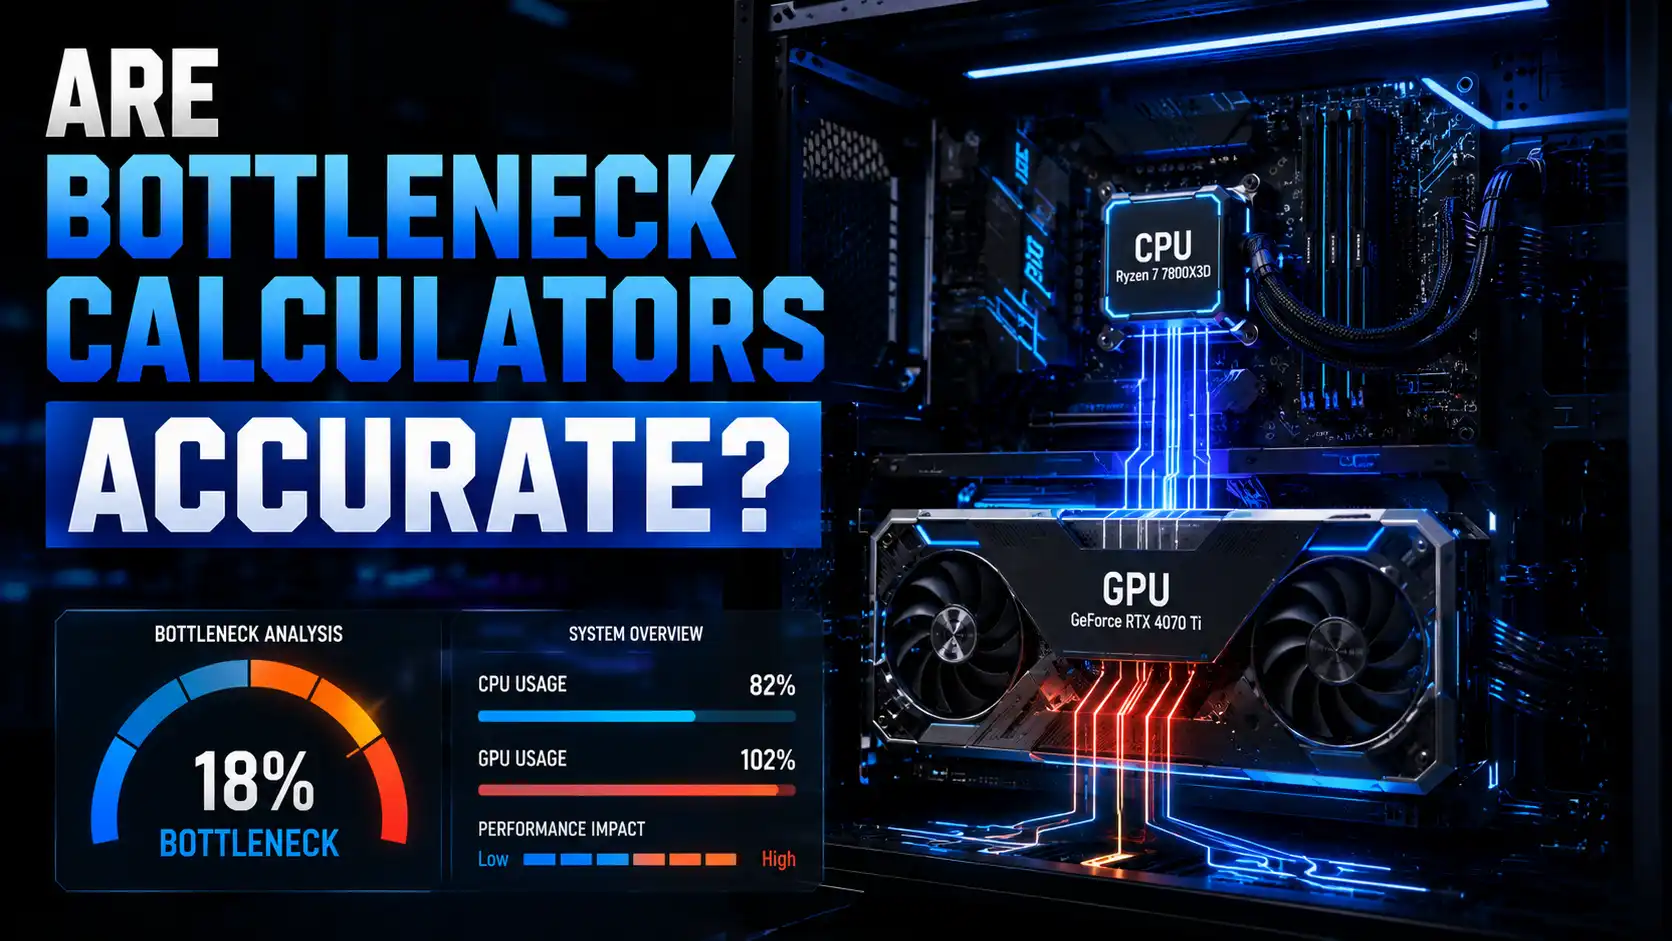
You typed your CPU and GPU into a bottleneck calculator, got a number like “12% bottleneck,” and now you’re not sure what to do with it. That number feels precise, but it’s built on assumptions the tool never tells you about — no game, no resolution, no driver version, no cooling setup. This breaks down exactly what these tools measure, how their math actually works, and where real monitoring software gives you a truer picture than any calculator can.
Quick Answer
Bottleneck calculators are rough estimation tools, not real measurements — they’re useful for spotting obvious mismatches but shouldn’t be treated as accurate FPS predictions.
They work off generalized benchmark averages, not your exact game, settings, or system, so treat the percentage as a starting point, not a verdict.
Key takeaways:
Can You Trust Bottleneck Calculators?
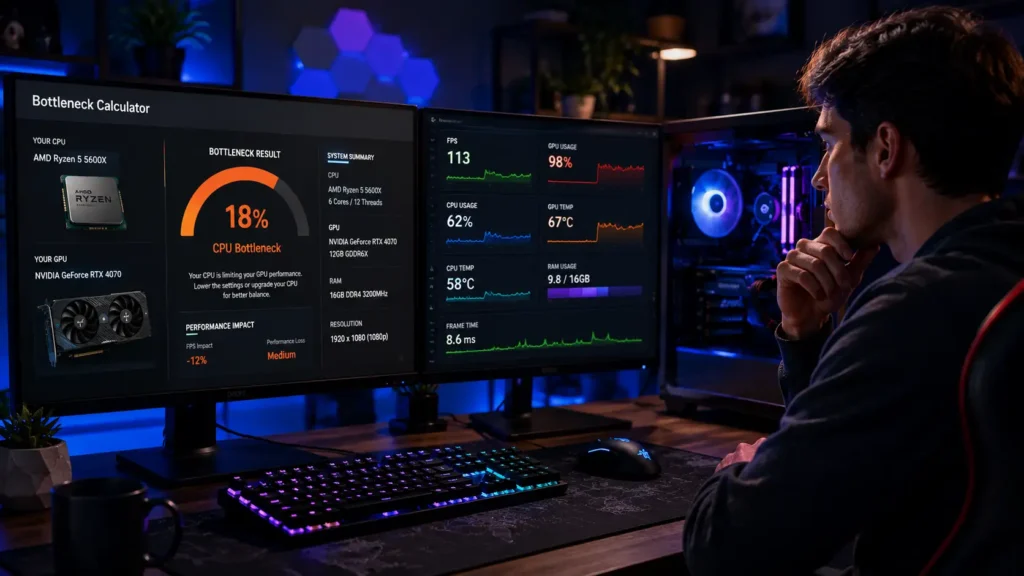
You can trust them for general direction, not for exact numbers. A calculator can correctly tell you that pairing a budget CPU with a flagship GPU is a bad idea, but it can’t tell you your actual FPS in a specific game at your specific settings.
When They’re Accurate
They tend to be closer to reality when the hardware gap is large and obvious — think an old quad-core CPU paired with a modern high-end GPU. In these extreme mismatches, almost any tool will point in the right direction.
When They’re Wrong
They fall apart with close hardware pairings, high refresh rate monitors, CPU-heavy games, or any workload where drivers, RAM, and background software matter more than the calculator’s simple formula accounts for.
What Is a Bottleneck Calculator?
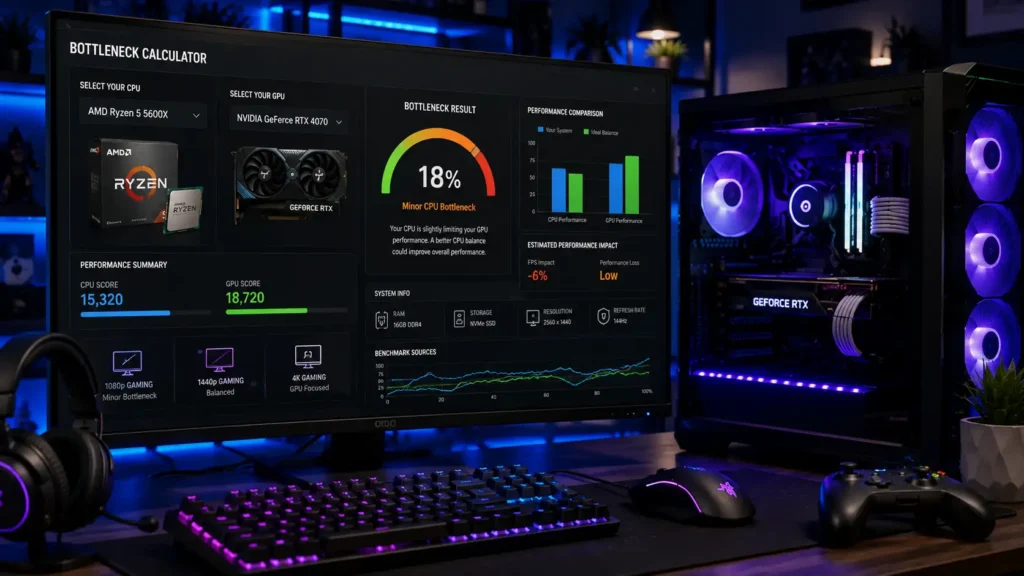
A bottleneck calculator is a website or app that compares your CPU and GPU against a database of benchmark scores and outputs a rough percentage showing which part is likely to hold the other back.
It’s a lookup tool, not a live diagnostic. Your PC never actually gets tested.
How It Works
You pick your CPU and GPU from dropdown menus, sometimes add your resolution and RAM, and the tool runs those choices through a formula. Behind the scenes, each part gets converted into a normalized performance index — a single number meant to represent its overall power — and the tool compares those two index numbers against each other. The wider the gap between the CPU index and the GPU index, the higher the reported bottleneck percentage, regardless of the actual game you’re going to run.
What Data It Uses
Most calculators pull from pre-loaded benchmark databases built from average FPS scores, synthetic tests like 3DMark, Cinebench, PassMark, or Geekbench, or crowd-submitted user results. None of this data comes from your actual PC, your actual game install, or your actual drivers.
How It Estimates Bottlenecks
The core idea is simple: rank your CPU’s performance tier, rank your GPU’s performance tier, and see how far apart they sit. A wide gap in tier produces a higher reported bottleneck percentage, regardless of what game you plan to play.
Are Bottleneck Calculators Really Accurate?
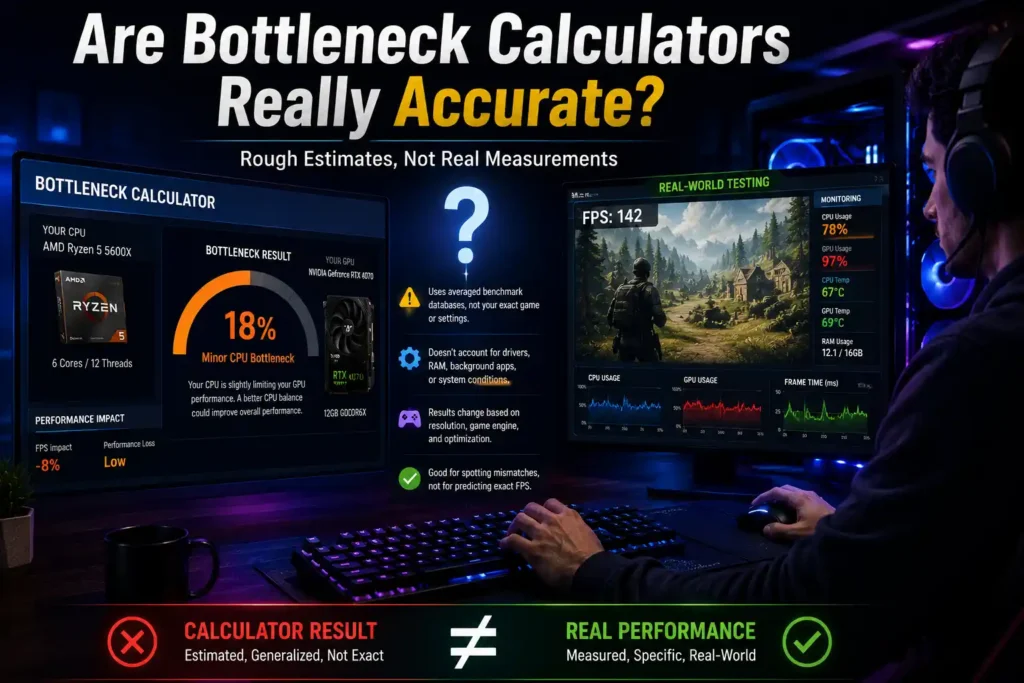
No, not in a precise sense — they give a directional estimate, often off by a wide margin from real gameplay results, because they ignore resolution-specific behavior, game engine differences, and system-level factors.
Treat the output as a ballpark figure, similar to a fuel estimate on a car’s dashboard.
Short Answer
They’re accurate enough to flag a badly mismatched build. They’re not accurate enough to predict your frame rate in a specific title.
Accuracy Rating
If you want a rough grade: useful for spotting a 40%+ mismatch, unreliable for anything under 15-20%, and essentially a coin flip once resolution, RAM speed, and game optimization enter the picture. Different calculators can give different percentages for the exact same hardware pair, which itself shows how loose the underlying math is.
Why Results Vary
Every calculator uses its own benchmark database, its own weighting formula, and its own update schedule. One tool might still be running outdated scores for a GPU that received a major driver performance boost, while another already reflects it. That alone can shift the reported percentage by 10 points or more.
What Affects Bottleneck Calculator Accuracy?
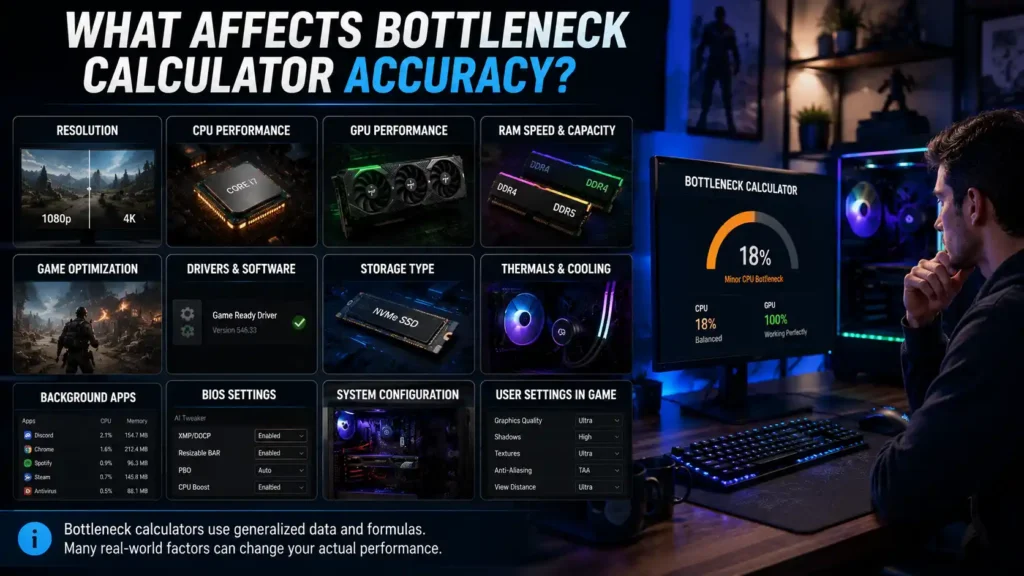
Resolution, RAM setup, storage type, game optimization, drivers, thermals, and BIOS settings all change real-world bottlenecks — and most calculators only account for one or two of these at best.
The gap between “what the calculator asked” and “what actually affects performance” is where the inaccuracy comes from.
CPU Performance
Core count, clock speed, and architecture (like AMD’s 3D V-Cache or Intel’s hybrid core design) all affect gaming performance differently depending on the game. A calculator usually reduces all of this to a single performance score, which flattens real differences between chips.
GPU Performance
VRAM capacity, memory bandwidth, and architecture generation matter just as much as raw compute power. Two GPUs with similar benchmark scores — whether from NVIDIA, AMD, or Intel — can behave very differently in VRAM-heavy titles at 4K, something most calculators don’t separate out. Upscaling technologies like DLSS, FSR, and XeSS add another layer, since they let a GPU render at a lower internal resolution and still output a sharp image, which shifts the real-world bottleneck picture that a static calculator never sees.
RAM Capacity & Speed
Faster RAM can meaningfully raise minimum FPS in CPU-bound games, especially on AMD platforms. Most bottleneck calculators either ignore RAM speed entirely or treat it as a minor checkbox rather than a real variable.
Single vs Dual Channel RAM
Running RAM in single-channel mode instead of dual-channel can quietly tank performance, sometimes worse than a CPU-GPU mismatch would. Bottleneck calculators almost never ask about channel configuration at all.
Storage (SSD vs HDD)
Storage speed rarely affects FPS once a game is loaded, but it heavily affects stutter during asset streaming in open-world titles. This has nothing to do with CPU or GPU bottlenecks, yet it’s often mistaken for one.
Resolution (1080p, 1440p, 4K)
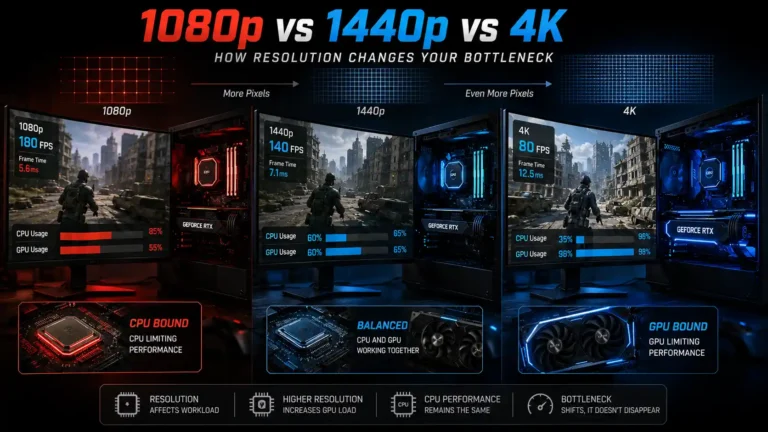
Resolution shifts the bottleneck itself. The same CPU-GPU pair can be CPU-bound at 1080p and GPU-bound at 4K, so a single flat percentage from a calculator can’t represent both cases accurately.
Graphics Settings
Turning up settings like shadows, ray tracing, or draw distance shifts load toward the GPU, while settings like crowd density, physics, or draw calls lean on the CPU. Frame generation features can also mask a CPU bottleneck by inserting AI-generated frames between rendered ones, which changes the perceived smoothness without changing the underlying hardware balance. Calculators don’t ask which settings, upscaling mode, or frame generation option you plan to use.
Game Optimization
Some engines are CPU-heavy by design (simulation and strategy games), while others lean almost entirely on the GPU. A calculator applies the same generic formula to every game, which is why its estimate can be close for one title and way off for another.
GPU Drivers
Driver updates can shift performance by a noticeable margin, sometimes more in certain games than others. Benchmark databases behind calculators are rarely updated fast enough to reflect the latest driver branch.
Windows Version
Scheduler changes between Windows versions can affect how well a CPU’s cores are used, particularly on hybrid-core or multi-chiplet designs. This is a real-world factor that no calculator accounts for.
Background Applications
Discord overlays, browser tabs, RGB software, and capture tools all eat CPU cycles and sometimes GPU resources. A bottleneck calculator assumes a clean system with nothing else running, which is rarely true in practice.
Thermal Throttling
A CPU or GPU that overheats will drop clock speed to protect itself, silently reducing performance below its rated spec. No calculator can know your case airflow or cooler quality.
Laptop Power Limits
Laptop CPUs and GPUs often run well below their desktop counterparts’ power limits, sometimes far below the “chip name” would suggest. Calculators built around desktop benchmark data can badly overstate laptop performance.
BIOS Settings
Memory profiles like XMP or EXPO, power limit settings, and Resizable BAR toggles all live in the BIOS and all affect real performance. None of this is visible to a calculator that only knows your part names.
Overclocking
An overclocked CPU or GPU can perform meaningfully above its stock benchmark score. Calculators compare stock-to-stock, so an overclocked system will almost always outperform its predicted bottleneck percentage.
Resizable BAR / Smart Access Memory
This feature lets the CPU access the GPU’s full VRAM at once instead of in small chunks, which can boost FPS in supported titles. It’s a setting most calculators never ask about, even though it can shift which component is the real limiter.
Factors Bottleneck Calculators Cannot Measure
Real-time FPS, 1% lows, frame time consistency, stutter, and driver-level behavior are all invisible to bottleneck calculators because none of these can be derived from a static spec sheet.
These are the exact numbers that actually describe how a game feels to play.
When Bottleneck Calculators Are Accurate
They’re most useful before you buy — for catching an obviously mismatched CPU-GPU pair, planning a basic build, or deciding what to upgrade next.
Use them as a sanity check early in the process, not as the final word once you own the hardware.
Choosing CPU & GPU Before Buying
When you’re picking parts for a new build, a calculator can stop you from making an obviously bad pairing, like a budget CPU with a flagship GPU. It won’t get you the perfect match, but it filters out the clearly wrong choices.
Basic Gaming Builds
For entry-level and mid-range builds, the performance tiers are usually far enough apart that a rough estimate is good enough. You don’t need pinpoint accuracy to know a budget CPU will hold back a high-end GPU.
Upgrade Planning
If you’re deciding whether to upgrade your CPU or GPU first, the calculator gives a reasonable starting signal. Just confirm it with real benchmarks for your specific games before spending money.
When Bottleneck Calculators Can Be Misleading
They lose accuracy fast in high refresh rate gaming, competitive titles, productivity workloads, streaming setups, and overclocked systems, since these all depend on details the calculator never asks about.
The more specialized your use case, the less a generic calculator can tell you.
High Refresh Rate Gaming
At 240Hz or higher, the CPU becomes the limiting factor far more often than at standard refresh rates. Calculators built around average FPS data usually underestimate how CPU-bound high-refresh gaming really is.
Competitive Games
Titles like competitive shooters are often CPU-heavy at low settings and low resolution, the exact opposite of what most graphics-focused benchmarks assume. A calculator tuned for AAA graphics-heavy games will misjudge these titles badly.
Heavy Productivity Workloads
Video editing, 3D rendering, and streaming encode workloads stress CPUs and GPUs completely differently than games do. Gaming-focused bottleneck calculators simply don’t apply here.
Streaming While Gaming
Running an encoder alongside a game adds real CPU and sometimes GPU load that a calculator has no way to account for. Your “bottleneck” while streaming can look nothing like the calculator’s prediction.
Overclocked Systems
Calculators compare parts at stock clocks, so they miss the effect of a tuned system entirely. An overclocked or undervolted CPU can turn a “bottleneck” pairing into a well-balanced one in practice, and a factory-overclocked GPU can do the same on the other side of the equation.
Bottleneck Calculator vs Real Benchmark Testing
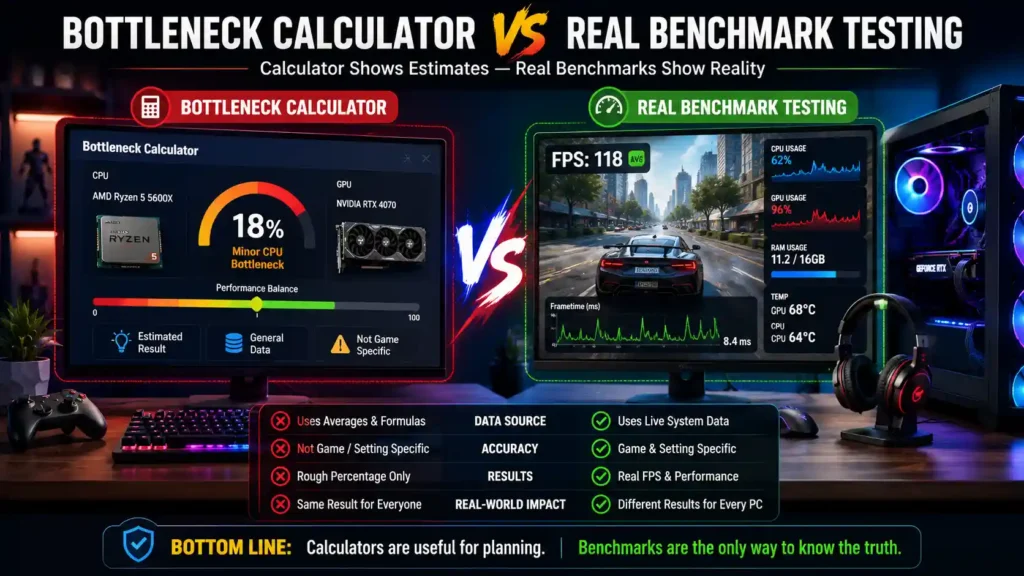
Calculators give you a fast, free estimate; real benchmarks give you actual numbers from actual games — use the calculator to narrow choices, then confirm with real testing.
| Feature | Bottleneck Calculator | Real Benchmarks |
|---|---|---|
| Speed | Instant | Takes time to test or research |
| Cost | Free | Free (if using existing reviews) |
| Accuracy | Rough estimate | Reflects actual game performance |
| Game-specific results | No | Yes |
| Accounts for settings/resolution | Rarely | Yes |
| Accounts for RAM, drivers, BIOS | No | Often yes |
| Best used for | Early planning | Final purchase decisions |
Real-World Examples
The same CPU-GPU pairing can show a “bottleneck” on paper while performing fine in practice, because real bottlenecks shift with resolution and game choice, not just part names.
Exact FPS numbers depend on the game and settings, so treat these as general patterns rather than fixed figures.
Ryzen 7 7800X3D + RTX 5070
This is a CPU-heavy chip paired with a mid-to-high-end GPU. In most games at 1440p and 4K, the GPU becomes the limiting factor first, so calculators typically report little to no CPU bottleneck here.
Ryzen 5 7600 + RTX 5090
Pairing a mid-range CPU with a flagship GPU is a classic case calculators flag heavily, especially at 1080p where the GPU can render frames faster than the CPU can feed it. At 4K, the gap narrows considerably since the GPU becomes the harder limit regardless of CPU.
Core Ultra 7 + RTX 4060
This is a fairly balanced mid-range pairing across most games and resolutions. Calculators usually show a low reported bottleneck here, and real-world testing tends to agree, since neither part is dramatically ahead of the other.
Ryzen 9 + RTX 5060
A high-end CPU paired with a mid-range GPU usually means the GPU is the limiting factor in most modern titles. The strong CPU mainly helps with 1% lows and CPU-heavy games rather than raw average FPS.
How to Verify a Bottleneck Yourself
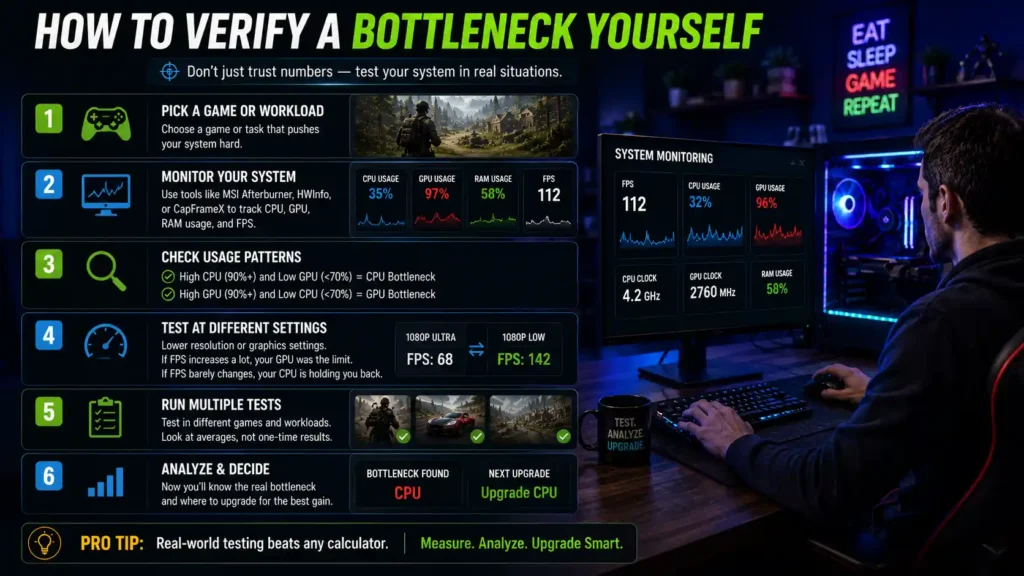
Run your own game with monitoring software open and watch CPU usage against GPU usage in real time — that tells you far more than any calculator ever will.
This takes ten minutes and reflects your actual system, not a generic database entry.
Using MSI Afterburner
Afterburner paired with RivaTuner Statistics Server gives you an on-screen overlay showing GPU usage, CPU usage, clock speeds, and frame times while you play. It’s free and works with almost any GPU brand.
Using HWiNFO
HWiNFO gives a deeper sensor readout, including per-core CPU load, temperatures, and power draw. It’s more detailed than Afterburner but slightly less beginner-friendly.
Using Windows Task Manager
Task Manager’s Performance tab gives a quick, no-install way to check overall CPU and GPU usage while a game runs in windowed or borderless mode. It’s less precise but good enough for a fast check.
Monitoring CPU Usage
Watch both total CPU usage and per-core usage. A single maxed-out core with low total usage can still mean a CPU bottleneck, since many games rely heavily on one or two threads.
Monitoring GPU Usage
GPU usage sitting consistently near 99-100% generally means the GPU is the limiting factor. GPU usage dropping well below that while FPS stays flat usually points toward the CPU instead.
Monitoring Frame Times
Look at frame time graphs, not just the average FPS number. Frequent spikes mean stutter, even if your average FPS number looks perfectly fine.
Signs of a CPU Bottleneck
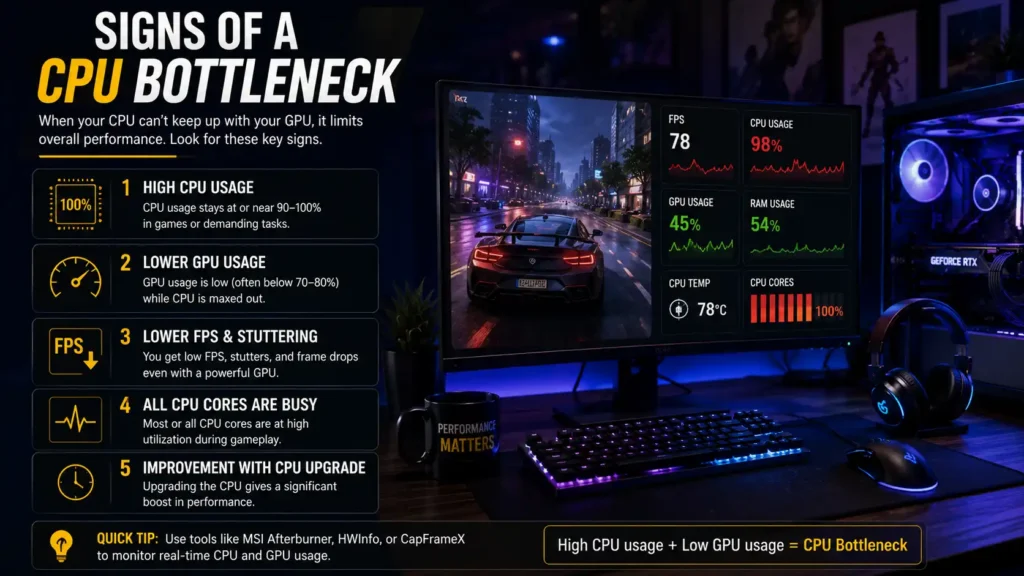
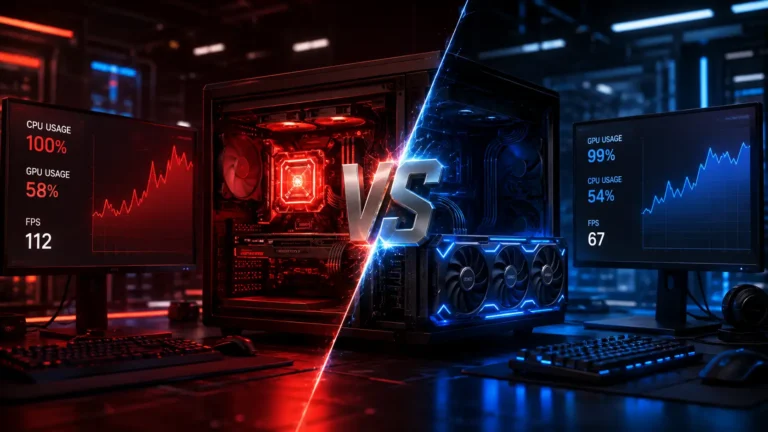
High CPU usage combined with GPU usage sitting well below 90-95% is the clearest sign your CPU is the limiting factor.
- High CPU Usage — one or more cores pinned near 100%.
- Low GPU Usage — the GPU is finishing frames faster than the CPU can prepare them.
- FPS Drops — especially in CPU-heavy areas like crowded scenes or open-world cities.
- Poor 1% Lows — average FPS looks fine, but dips feel rough.
- Stuttering — inconsistent frame delivery even with a stable average FPS.
Signs of a GPU Bottleneck
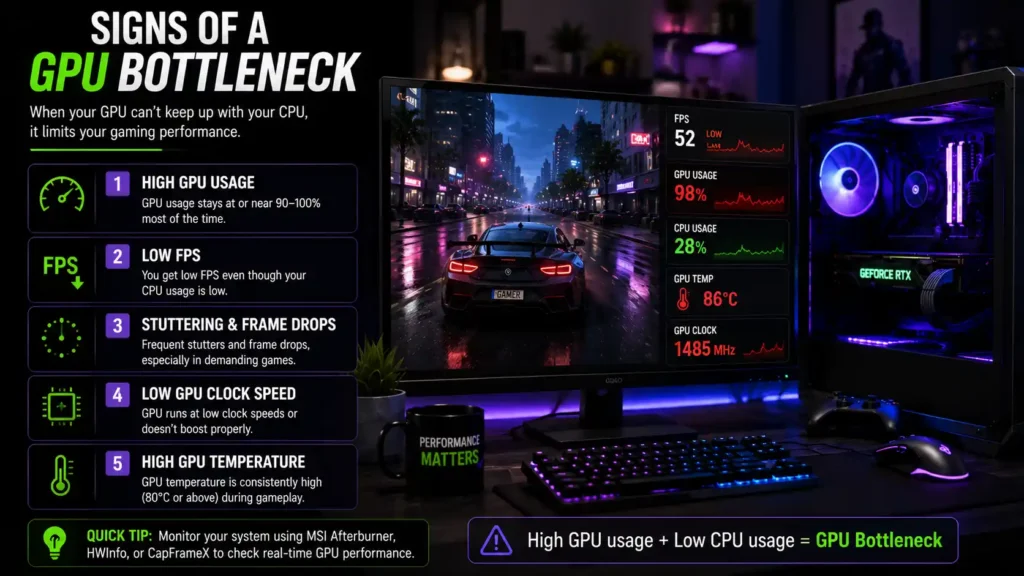
GPU usage pinned near 99-100% while CPU usage stays comfortably lower is the standard signature of a GPU bottleneck.
- GPU at 99-100% — the GPU is the part working hardest, and the limiting factor.
- CPU Usage Low — the CPU is waiting on the GPU, not the other way around.
- Stable Frame Times — frame delivery tends to be smoother, since the GPU is the consistent limiter.
- Lower FPS at Higher Resolutions — a strong indicator the GPU, not the CPU, is running out of headroom.
Common Mistakes When Using Bottleneck Calculators
The biggest mistake is trusting the percentage as a fixed truth instead of a rough estimate that ignores resolution, RAM, drivers, and the specific game you actually play.
How to Get More Accurate Results
Cross-check multiple calculators, then confirm with real YouTube benchmarks and professional reviews for your exact games before making a purchase decision.
No single source should be your only input.
Compare Multiple Calculators
Run the same CPU-GPU pair through two or three different calculators. If they disagree by a wide margin, that’s your sign none of them should be treated as precise.
Check YouTube Benchmarks
Search for your exact CPU-GPU combo, or the closest available pairing, tested in the games you actually play. This gets you real FPS numbers instead of a generic percentage.
Read Professional Reviews
Outlets like Tom’s Hardware, TechPowerUp, and Digital Foundry publish detailed CPU and GPU reviews that test across many games and resolutions, giving you a much more complete picture than a single bottleneck score. Manufacturer documentation from NVIDIA, AMD, and Intel is also worth checking for driver notes and official performance claims tied to specific GPU or CPU generations.
Compare FPS Databases
Sites that aggregate FPS results across many hardware combinations let you triangulate performance even if your exact pairing hasn’t been tested directly.
Should You Upgrade Based on a Bottleneck Calculator?
Use the calculator as one input among several, not your only reason to spend money on an upgrade. Pair it with real benchmarks for your specific games before deciding.
Yes, If…
The calculator shows a large, obvious mismatch, multiple calculators agree, and real benchmarks for your games back up the same conclusion. In that case, the estimate is probably pointing at something real.
No, If…
The reported bottleneck is small (under 15-20%), only one calculator shows it, or your actual in-game monitoring doesn’t match what the tool predicted. In that case, save your money and trust your own testing instead.
Frequently Asked Questions
Final Verdict
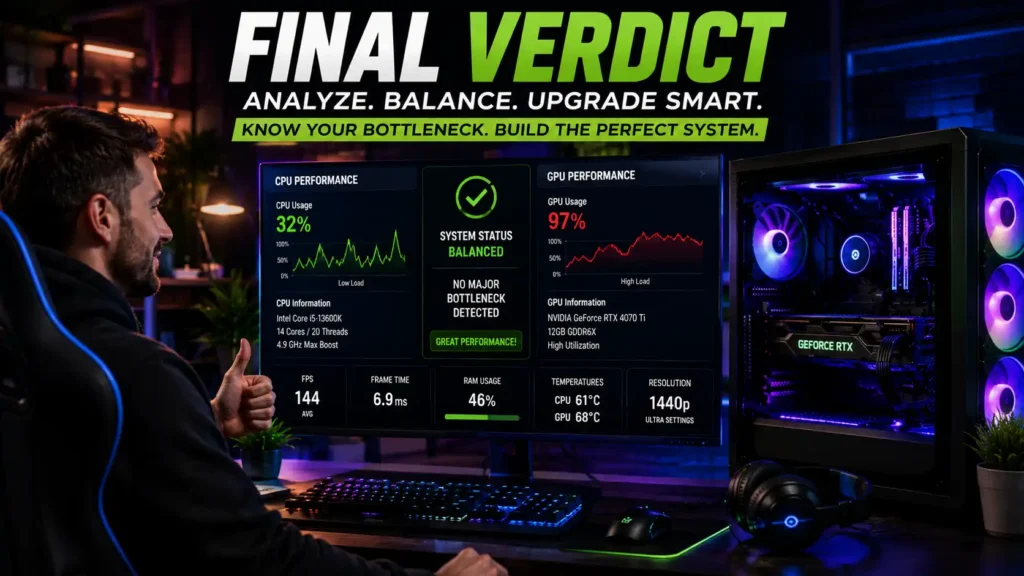
Bottleneck calculators are a starting point, not a diagnosis. Use one to catch obviously bad hardware pairings, then confirm with real benchmarks and your own in-game monitoring before spending money on an upgrade.
Before you act on a bottleneck percentage, run through this quickly:
- Check what resolution and settings the calculator assumed, and whether they match how you actually play.
- Run the same CPU-GPU pair through a second calculator to see if the numbers agree.
- Search for a real benchmark of your exact hardware, or the closest match, in the games you care about.
- Open MSI Afterburner or HWiNFO during a real session and watch your actual CPU and GPU usage.
- Only upgrade if the mismatch shows up consistently across steps one through four, not just the first one.
If your GPU sits pinned at 99% while your CPU stays comfortably lower during real gameplay, that single reading tells you more than any percentage a calculator could hand you.